Find Holdings Requiring Review on Daily TickerScope and Rotation Review. Daily TickerScope highlights what needs attention; Rotation Review lets you examine holdings and compare alternatives.
Spot review candidates on Daily TickerScope; compare them in Rotation ReviewIllustrative example — placeholder holdings, not live results.
⌕
Holdings Requiring Review
Review weaker holdings first, then compare them with stronger qualifying alternatives.
PortfolioMy Portfolio
Strong Alternative UniverseCombo SPY-QQQ
1. Weakest Holdings
Holding AHolding B
Start with holdings that no longer qualify.
→Review Weakest Holdings and Alternatives→
2. Strong Alternatives
Candidate ACandidate B
Compare qualifying companies from your chosen universe.
3. Open the review. Use Daily TickerScope to see holdings requiring attention. Open Rotation Review to compare weaker holdings with stronger alternatives before deciding what to do.
TickerScope begins with stocks saved in My Portfolio. Holdings Requiring Review are holdings whose existing Trend Alignment Score is currently 0—the state TickerScope describes as no longer qualifying.
For Strong Alternatives, TickerScope examines the selected Strong Alternative Universe. It excludes stocks already held in My Portfolio, keeps candidates that pass the existing Frontier qualification and have score and regime data, and ranks them using the shared score-and-regime ordering.
The initial alternative universe is the SPY - QQQ Combo (shown as Combo SPY-QQQ in the Rotation Review universe selector) when that universe is available and no saved preference overrides it. It combines the major stocks represented in SPY and QQQ into a broader candidate pool for finding stronger alternatives.
My Portfolio↓TickerScope identifies weaker holdings↓Holdings Requiring Review↓TickerScope searches the selected universe↓Strong Alternatives↓You compare the candidates
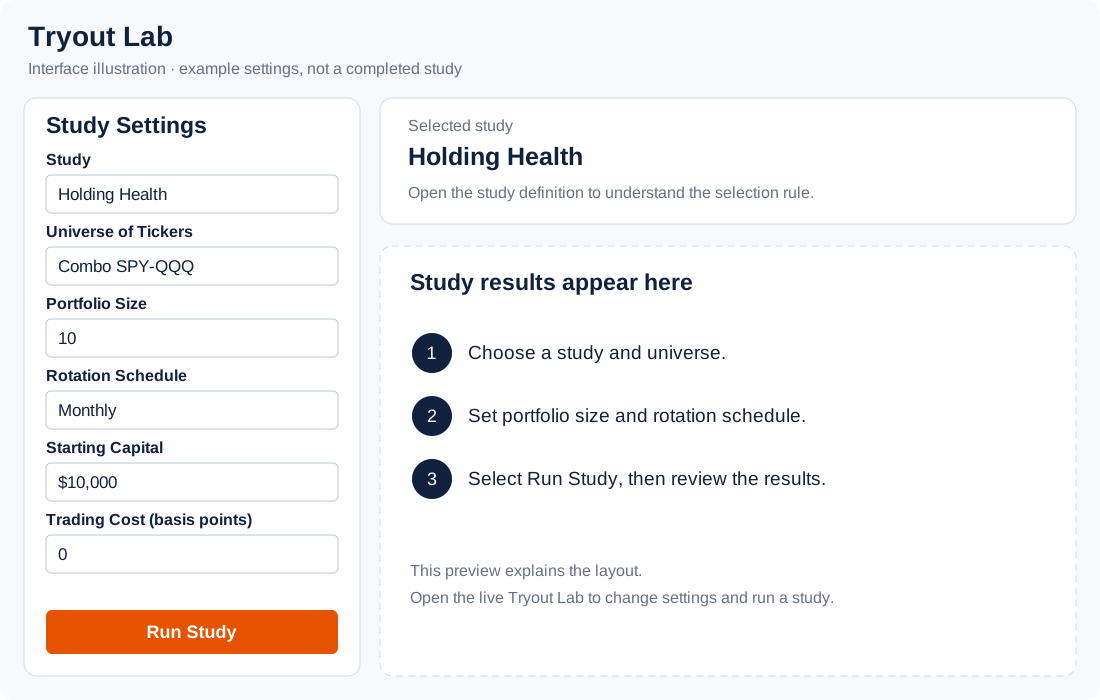
Tryout Lab
Illustrated interface preview with example settings. Select the image to view it full size.
Every Tryout Lab study is a different rule for selecting a portfolio. Each study applies a clearly defined rule to decide what the portfolio owns.
You can explore an idea by changing the Study, Portfolio Universe, Portfolio Size, and Rotation Frequency.
Fixed
Definition
Hold the first selected companies from the authoritative universe weight order without rotating them.
What the study measures
The result of holding the first selected companies in the universe’s existing authoritative weight order.
Why it can be useful
A simple baseline for seeing how a concentrated slice of an index behaves over time.
When it tends to perform well
It tends to benefit when the universe’s largest weighted companies remain market leaders.
What it does not attempt to measure
It does not measure trend strength, valuation, regime, or when to trade.
Regime Ownership
Definition
Own a ticker only while it is in one of the selected moving-average regimes.
What the study measures
Whether a ticker is in one of the selected moving-average regimes on each evaluation date.
Why it can be useful
It lets you explore whether owning only selected market structures can change portfolio behavior.
When it tends to perform well
It tends to perform well when the selected regimes persist and coincide with favorable price movement.
What it does not attempt to measure
It does not rank companies by valuation, fundamentals, or relative return.
Buy Today Score
Definition
Own weight-ordered candidates only when Buy Today Score equals 100.
What the study measures
Whether each weight-ordered candidate has a production Buy Today Score of 100 on the evaluation date.
Why it can be useful
It tests a strict current-condition qualification rule while preserving the universe’s weight order.
When it tends to perform well
It tends to perform well when fully aligned Buy Today conditions persist after a company qualifies.
What it does not attempt to measure
It does not estimate fair value, earnings quality, or future returns.
All Scores - 100
Definition
Require Buy Today, Stack, and Fanning scores to equal 100 simultaneously.
What the study measures
Whether Buy Today, Stack, and Fanning scores all equal 100 at the same time.
Why it can be useful
It explores a more selective portfolio that requires several technical conditions to agree.
When it tends to perform well
It tends to perform well when strongly aligned and widening trends continue.
What it does not attempt to measure
It does not measure company fundamentals, diversification, or valuation.
Relative Strength
Definition
Rotate using shared regime, stack, fanning, and relative-strength evidence.
What the study measures
A candidate’s relative strength together with the shared regime, stack, and fanning evidence used by the production rotation engine.
Why it can be useful
It helps explore whether repeatedly owning stronger candidates improves a portfolio relative to a fixed selection.
When it tends to perform well
It tends to perform well when market leadership is persistent enough to survive the chosen rotation schedule.
What it does not attempt to measure
It does not measure intrinsic value or guarantee that recent leaders will remain leaders.
Momentum
Definition
Rank and rotate using the shared multi-lookback momentum engine.
What the study measures
Price momentum across the selected lookback measure, using the shared multi-lookback momentum engine.
Why it can be useful
It lets you compare ways of rotating into securities with stronger recent price performance.
When it tends to perform well
It tends to perform well when price trends and leadership persist rather than reverse abruptly.
What it does not attempt to measure
It does not measure business quality, valuation, or predict turning points.
Liquidity
Definition
Rank completed-session dollar volume and current participation against historical baselines.
What the study measures
Dollar trading volume, current participation relative to its 20-session average, and the 20-session average relative to its 60-session baseline.
Why it can be useful
It tests whether owning the most liquid and increasingly active companies from the selected weighted universe produces useful portfolio results.
When it tends to perform well
It tends to perform well when high and rising market participation persists after each scheduled selection.
What it does not attempt to measure
Liquidity and volume can show trading activity, but they do not prove whether institutions are buying or selling.
Stacking Score
Definition
Limit ownership to selected production Stack Score states.
What the study measures
Whether a candidate’s production Stack Score is in the selected eligible state on the evaluation date.
Why it can be useful
It isolates moving-average ordering so you can study how trend alignment affects a weight-ordered portfolio.
When it tends to perform well
It tends to perform well when the selected moving-average alignments remain stable and price follows the established structure.
What it does not attempt to measure
It does not independently measure fanning, relative strength, fundamentals, or valuation.
Holding Health
Definition
Rank a 0–100 score combining Buy Today, Stack, Fanning, Regime, and MA9 slope.
What the study measures
A 0–100 technical-health score made from Buy Today (up to 30 points), Stack (25), Fanning (20), Regime (15), and 9 SMA Slope (10).
Why it can be useful
It combines five current technical conditions into one consistently scaled measure for ranking historically eligible tickers.
When it tends to perform well
It tends to perform well when broad technical alignment and positive short-term trend conditions persist after selection.
What it does not attempt to measure
It does not include Universe Weight, Global Rank, Universe Rank, company size, valuation, or fundamentals.
Compress the History Into a Heatmap
Daily price and regime history can be compressed into Heatmap trading-date cells. The heatmap removes most chart detail and keeps the regime state for each completed trading period.
Each column represents the same date for every ticker, which makes it possible to compare changes in market structure across a portfolio without reading a separate price chart for every holding.